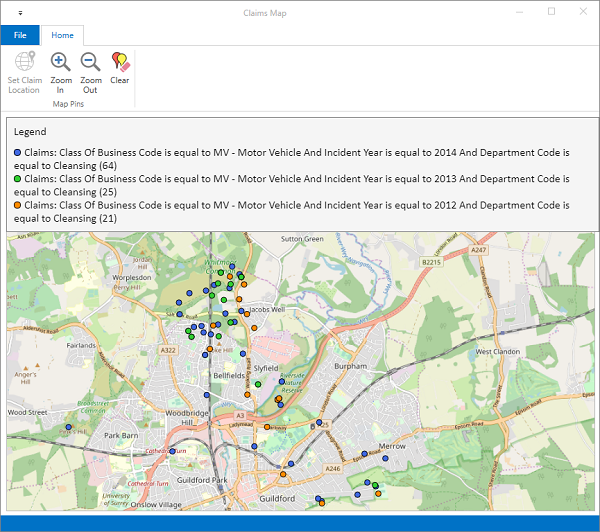
JCAD’s claims management system, LACHS version 5, has a fantastic new feature, geo-mapping. The geo-mapping module allows for any claims data that has a location to be plotted onto a map allowing for greater analysis. This analysis provides a clear visualisation allowing for hot spots and trends to be quickly highlighted. This trend analysis encourages greater communication, more efficient business processes & problem solving that in turn leads to reduced claim volumes and cost savings.
Let me share some examples with you of how using geo-mapping could help reduce your claim volumes.
- Bin collection
Using geo-mapping, a council could plot where all the claim incidents have occurred during waste collection. The claims can be distinguished by type too ‘“ public liability, internal claims etc.
When using the geo-mapping feature, it may become apparent that there are several claims made in a certain street. This could be due to the road being narrow with cars parked either side of the road. With the information to hand, the council could talk to the waste management department and perhaps change the route so that this street has its bins collected later in the route so that people would have gone to work alleviating the number of cars parked in the road. This would hopefully reduce the number of claims in this street.
Claims can be plotted by driver too. This will highlight if a driver has significantly more claims compared to other drivers. Providing additional driving courses may assist with reducing claim volumes.
Reducing claim volumes will help you reduce insurance premiums = cost saving.
- Pot hole claims
Plotting pot hole claims on a map will allow quick visualisation of problem areas. It will allow for more informed decisions to be made about the urgency and prioritisation of road repairs. Scheduling repairs more appropriately geographically may provide cost efficiencies to the Council too. Comparing pot hole data from one year to the next will help measure the success of the previous year’s road maintenance.
Improving road maintenance and reducing claim volumes will help you reduce insurance premiums = cost saving.
- Water company ‘“ leaks
Plotting the location of leaks that have resulted in a claim will highlight any problem areas that perhaps have recurring issues. This could be due to old infrastructure and pipes needing to be replaced. With the areas plotted this allows for greater visibility and priority repairs to be scheduled effectively. Comparing year on year will also allow the effectiveness of the previous year’s maintenance to be measured. Using a claims management system, you will have substantial reporting available to demonstrate your claim volumes reducing year on year and will provide you with a great opportunity to reduce your insurance premiums.
Reducing the claim volumes will help you reduce your insurance premiums = cost saving.